Saturday, December 28, 2013

PRACTICAL 5 : MICROSCOPIC ANALYSIS OF PARTICLE SIZE AND SHAPE


OBJECTIVE:

1. To analyse the particle shape and size under the microscope.
2. To describe the distribution particle size and shape.

INTRODUCTION:

The particle shape and size can be analyzed by many methods. One of it is by using a microscope, which has been done in this experiment. This analysis can be used to determine the diameter, shape, and surface area of a particle. During the experiment, we were given different type of sand to be observed and analyzed such as the size, shape and arrangement. We are using various kind of sizes of sand, which are 355 µm, 500 µm, 850 µm, lactose and also sand with all of this sizes  that already been mixed together. Some batches of samples may differ by such a small amount that this difference is lost during the translation to a circle equivalent or spherical-equivalent diameter.  In this experiment, we observe different sizes of particles under a microscope and we draw the shape of particles that we have observed.


MATERIALS AND APPARATUS:

Microscope, sand with particle size of 355 µm, 500 µm, 850 µm, lactose and also sand with various sizes.


PROCEDURES:

1) 5 different types of samples were analyzed by using microscope, by observing the size and shape of given particle.
2) The samples were examined first by 4X10 magnification, followed by 10X10 magnification.
3) The particle shape is sketched and the overall particle shape of that material is stated.

OBSERVATIONS :

 Size of sand: 355 µm
(All the particles are small, same size and irregular in shape.)
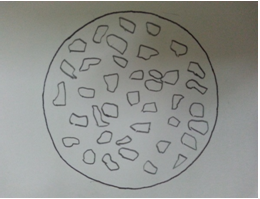


                                                               a) 4 X 10 magnification


                                                            b) 10 X 10 magnification

Size of sand: 500 µm
(All the particles are larger than 355 µm, the size is almost same and the shape is irregular.)


                                                              c) 4 X 10 magnification


                                                                 d) 10 X 10 magnification

Size of sand: 850 µm
(The particles are larger compare to 500 µm, particles that present on the upper position look larger and can be seen clearly while particles at the lower position look smaller. The shape of the particles is irregular and without a defined shape.)


                                                               e) 4 X 10 magnification


                                                               f) 10 X 10 magnification


Lactose
(All particles are small, some of them have round shape while others are irregular in shape.)
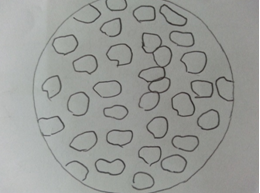

                                                                g) 4 X 10 magnification


                                                                h) 10 X 10 magnification

Sand of various size
(All the particles have different size, most of them have irregular shape with different number of edges and sides.)


                                                                i) 4 X 10 magnification


                                                               j) 10 X 10 magnification


QUESTIONS:

1. Briefly describe the various statistical methods that can be used to measure the diameter of a certain pa
rticle.
        One of the methods is projected area diameter which is measured based on the equivalent area to that of projected image of that particle. Projected area is two-dimensional area measurement of a three-dimensional object by projecting its shape on to an arbitrary plane. Besides, another useful method is the projected perimeter diameter which is based on the circle having the same perimeter as the particle. Both of these methods are independent upon particle orientation. They only take into account of 2 dimensions of the particle, thus inaccurate for unsymmetrical particle.

        Feret’s and Martin’s diameter that considering the orientation of the particle are another methods to measure the diameter of certain particle. They are two parameters in this method which are Feret’s diameter and Martin’s diameter. Feret’s diameter is the mean distance between two parallel tangents to the projected particle perimeter while Martin’s diameter is the mean chord length of the projected particle perimeter, which can be considered as the boundary separating equal particle area.

        The other method is by using Fourier analysis to provide an accurate quantification of particle morphology and texture. Three lower order Fourier descriptors, denoted “Signature Descriptors” provide measures of Elongation, Triangularity and Squareness, whilst an additional descriptor, denoted “Asymmetry” provides a measure of particle irregularity. They describe the overall shape of soil particles (defined as “morphology”). A summary of higher order descriptors provides textural information which is related to local roughness features (defined as “texture”).
                 

2. State the best statistical method for each sample that you used.

As such, the best statistical method is Feret’s and Martin’s diameter. It is because both of these are the statistical diameter which is the average over many different orientations to produce a mean value for each particle diameter. This will give an average value of diameter in more orientation and giving an average diameter value which is more accurate. Besides, since it is accessing the three-dimensional image of particle, we can use the electron microscope that considering the orientation and shape of the image.


DISCUSSION:

        The ability to analyze and characterize particle size and shape can significantly improve the manufacturing efficiency and product performance. Thus, we can use of microscopy and image analysis as the most reliable technique to characterize particle shape, size and volume distribution. From this practical, it is found that the overall shape of the sand is asymmetrical. One of the methods used to measure a particle is the projected area diameter which is measured based on the equivalent area to that of projected image of that particle. Another method is the projected perimeter diameter which is based on the circle having the same perimeter as the particle. Both of the methods do not account the 3 dimensional shape of particle (orientation). They only consider the 2 dimensions of the particle, thus it is inaccurate for unsymmetrical particle.

        During the experiment, we put different types of sand on slide to be directly observed them using a light microscope. The sand should be spread evenly and just thin layer to avoid agglomeration that will affect the observation. We observed that the particles are irregular in shape. The size analysis is carried out on two-dimensional image of particles which are generally assumed to be randomly oriented in 3-dimensional and they are viewed in their most stable orientation.

        Feret’s and Martin’s diameter that considering the orientation of the particles is one of the methods to measure the diameter of particle. Feret’s diameter is the mean distance between two parallel tangents to the projected particle perimeter while Martin’s diameter is the mean chord length of the projected particle perimeter. The best statistical method is Feret’s and Martin’s diameter because both of them use statistical diameter which are the average over many different orientations to produce a mean value for each particle diameter. Besides, since it is accessing the three-dimensional image of particle, we can use the electron microscope that considering the orientation and shape of the image.

CONCLUSION:

Different types of sands have different shape and size which can be analyzed through a light microscope. We are able to determine the overall distribution of shape and size of this particle which are asymmetrical and irregular.


REFERENCES:

1. Pharmaceutics, The science of dosage form design (2nd Edition) Michael E.Alton Edinburgh London New York Philadophia St Louis Sydney Toronto 2002.
2. http://www.en.wikipedia.org
3. http://www.jenike .com
4. Physicochemical Principals of Pharmacy (2nd Edition) AT Florence and D.Attwood, The Macmillan Press Ltd.


Friday, December 27, 2013

PRACTICAL 1 : UNIFORMITY OF DIAMETER, THICKNESS AND HARDNESS


Objective:

To test uniformity on diameter, thickness and hardness of the tablets by using Tablet Testing Instrument

Introduction:

        Tablet uniformity is important and is used to make sure that every tablet contains the amount of drug substances intended with only little variation among tablets within a batch. Due to the increased awareness of physiological availability, the uniformity test has been included for all coated and uncoated tablets. Among the various oral dosage forms, tablets are the most common and easiest way to be administered. Tablets are defined as solid preparations each containing a single dose of one or more active ingredients and obtained by compressing uniform volumes of particles. Besides, tablets are used mainly for systemic drug delivery but also for local drug action. Related to this reason, there is experiment conducted to test on the uniformity of diameter, hardness and thickness of the tablets which will influence the efficiency of the tablets to delivery drugs.

        PHARMATEST PTB 311 is one of the most popular instruments for measuring thickness up to 15mm, diameter up to 40mm and hardness up to 300N. Uniformity of the diameter of tablet follows the pharmacopoeial standard. All of the percentage average deviation value must not exceed ± 5% for tablets with diameter less than 12.5 and ± 3% for diameter of 12.5 mm or more. All of this test could be done by using PHARMATEST PTB 311. The thickness and hardness test are both under non-pharmacopoeial standards and is widely used by the manufacturers itself.


Materials and Apparatus:
10 Uphamol Cold and Flu tablets, Tablet Testing Instrument (PHARMATEST PTB 311)


Procedure:

1.      10 tablets of Uphamol Cold and Flu are selected and then, the test for diameter uniformity, thickness, and hardness is carried out by using the Tablet Testing Instrument (PHARMATEST PTB 311).

2.      Then the value of the diameter, thickness, and hardness is taken. The deviation of each is calculated and the deviation of individual unit from the mean diameter should not exceed ± 5% for tablets with diameter of less than 12.5 and ± 3% for diameter of 12.5 mm or more.


Results/Calculation:


     Discussion:

        In this experiment, 10 Uphamol Cold and Flu tablets are used to measure their thickness, diameter and also hardness. From the results that we obtained, the diameter of all the tablets is less than 12.50mm and the deviation does not exceed ± 5% based on the calculation. Thus, the uniformity of the diameter of tablet follows the pharmacopoeial standard. Each tablet with diameter more than 12.5mm, the deviation should not exceed ±3% while for tablet with diameter less than 12.5mm, the deviation should not exceed ±5%. From the measurement done by the PHARMATEST PTB 311, we can conclude that all the tablets pass the test as the deviation of each diameter for each tablet is not out of the range required.


The deviation can be calculated based on the equation below:


        Based on the calculation, for diameter of tablets which is bigger than the mean diameter, the deviation obtained will be a positive value. On the other hand, for tablet with diameter smaller than the mean diameter, the deviation obtained will be a negative value. However, errors may occur if the deviations are out of the required range. The slight deviations of diameter of the tablets may either be due to an uneven feeding of granules into die or may be due to the irregular movement of lower punch.

         In this experiment, the average thickness for 10 tablets is 4.80mm, the average diameter is 11.99mm and the average hardness is 174.7N. The thickness and hardness test are both under non-pharmacopoeial standards and is widely used by the manufacturers itself. Tablet thickness is an important quality control test for tablet packaging. The thickness of tablet can affect the therapeutic effectiveness of tablets. Very thick tablet affects packaging either in blister or plastic container. Tablet thickness is determined by the die of the tableting machine and is generally controlled to minimize appearance problems, to assure that tablets will fit into the container and to assure that they can be accurately counted by the filling equipment. Some filling equipment depends on the uniform thickness of the tablets as a counting mechanism.


(PHARMATEST PTB 311 is used to measure the thickness, diameter and also hardness of tablets.)

          Tablets usually need to have certain hardness or strength to withstand and overcome mechanical shock so that they do not break easily. In addition, tablets should be able to withstand reasonable abrasion and friction. Adequate tablet hardness and resistance to powdering and friability are necessary requisites for consumer acceptance. It also may influence tablet disintegration and affect the dissolution rate. It may be especially important to carefully monitor tablet hardness for drug products that possess real or potential bioavailability problems or are sensitive to altered dissolution-release profiles as a function of the compressive force employed.


        PHARMATEST PTB 311 is one of the most popular instruments for measuring thickness up to 15mm, diameter up to 40mm and hardness up to 300N. In the real manufacturing process, tablet uniformity is important and is used to make sure that every tablet contains the amount of drug substances intended with only little variation among tablets within a batch. If these test has been conducted and the percentage deviation is exceed than it should be, the manufacturer need to remake the tablets by modifying the ingredients used whether in amount of ingredients or change the types of ingredient that had been choose. This test is important to make sure the drugs in form of tablets could be supply to the patients and it give the therapeutic effect effectively by having good properties such as good dissolution rate, good disintegration within the body and have a good metabolism to avoid any negative side effects.

Conclusion:

        In this experiment, all the 10 tablets have uniform diameter, thickness and hardness by the measurement from Tablet Testing Instrument. All tablets obey the standard properties required.

Reference:
  1. http://www.pharmainfo.net/tablet-evaluation-tests/content-uniformity
  2. http://www.pharma-test.de/ptb311e/
  3. http://www.slideshare.net/mallikarjunvasm/quality-control-tests-for-tablets#btnNext
  4. http://hussain-ku.blogspot.com/2010/11/quality-control-tests-for-tablets.html
  5.  http://pharmlabs.unc.edu/labs/tablets/evaluation.htm

PRACTICAL 2 : TABLET FRIABILITY


Aim : 

1) To determine the percentage loss of weight of tablets.
2) To determine the physical strength of tablets upon exposure to mechanical shock or atrrition.


Introduction :

            Friability is defined as the percentage of weight loss by tablets due to mechanical action during the test. The tablets are weighed before and after testin. The friability is expressed as a percentage loss on pre test tablet weight. Friability refers to the ability of the compressed tablet to avoid fracture and breaking during the transport. It is related to tablet harness and is designed to evaluate the ability of tablet to withstand aberration in packing, handling and shipping. It is measured by the use of friablity tester


Apparatus and Materials :

Paralgin tablets, weighing boat, drum of the tablet abration and friability tester.


Procedures :
  1. 10 tablets were selected and weighed.
  2. The tablets were put into the drum of the tablet abration and friability tester. The rate of rotation was set to 25 rpm, time to 10 minutes and the operation was started.
  3. At the end of the operation, all the tablets were removed and freedom from dust or powder was ensured (brush was used). The tablets were reweighed. The percentage loss of weight was determined.
  4. Compressed tablet should nor lose more than 1% of its weight.


Results and Calculations : 


Discussion :


Conclusion :

            As a conclusion, the weight difference between before and after the tablet friability operation is 6.8212 g – 6.6935 = 0.1277 g. The percentage loss of weight is 1.87% and it is more than 1% of it should be. This may happened because of the expiry date of the tablets.


References :

  1. http://www.pharmacopeia.cn/v29240/usp29nf24s0_c1216.html
  2. http://jpdb.nihs.go.jp/jp14e/14data/Tablet_Friability_Test.pdf
  3. http://pharmlabs.unc.edu/labs/tablets/evaluation.htm

PRACTICAL 3 : UNIFORMITY OF WEIGHT OF TABLETS AND CAPSULES


Objectives

  1. To test the uniformity of weight of tablets and capsules
  2. To ensure the consistency of dosage unit

Introduction

        To ensure the consistency of dosage units, each unit in a batch should have a drug substance content within a narrow range around the label claim. Dosage units are defined as dosage forms containing a single dose or a part of a dose of drug substance in each unit. The uniformity of dosage units specification is not intended to apply to suspensions, emulsions, or gels in unit-dose containers intended for topical administration. The term “uniformity of dosage unit” is defined as the degree of uniformity in the amount of the drug substance among dosage units. Therefore, the requirements of this chapter apply to each drug substance being comprised in dosage units containing one or more drug substances, unless otherwise specified in the individual monograph. The uniformity of dosage units can be demonstrated by either of two methods, Content Uniformity or Weight Variation.

Procedures

Tablets

1. 20 tablets are weighed. The average weight was determined.
2. Then, tablets was weighed individually and for each tablet, the percentage of deviation of its weight from the average weight was determined

3. The deviation of individual weight from the average weight should not exceed the limits given below.


The percentage of deviation is calculated using the formula as below.


Capsules

1. 20 capsules are selected at random.
2. One capsule was weighed. The capsule was opened and the contents are removed as
completely as possible. The emptied shells are weighed. The net weight of its contents are
determined, that is by subtracting the weight of shells from the weight of the intact capsule.
3. The procedure are repeated with another 19 capsules.
4. The average net weight are determined from the sum of individual net weights.
5. The percentage of deviation from the average net weight for each capsules are determined.


The deviation of individual net weight should not exceed the limits given below. 


The percentage of deviation is calculated using the formula as below.


Results


Tablets


Capsules


Calculations

1. Average weight of tablet        

=  Total weight of 20 tablets
                         20

= 13677.1
                    20

                ≈  683.9 mg

2. Average net weight of capsule

                =  Total net weight of 20 tablets
                         20

                =  296.3 mg


Discussion

                Based on the experiment, the uniformity of weight was determined by using tablets and capsules in order to make sure that  the dosage units is consistent. From the result obtained, the tablets used has an average weight of 683.9 mg which is under  the category of ‘250mg and more’. All the 20 tablets that have been carried out did not exceed  the limit of + 5.0% and therefore, they are considered to pass the test. For the capsules, all 20 capsules have average net weight of 296.3 mg. Therefore, it is under  the category of  ‘300mg and above’ category. All the capsules have the percentage of deviation within the + 7.5%, which did not exceed the limitation,  so, all of the 20 capsules pass the test.


Conclusion

        From this experiment, the percentage deviation from the average weight does not exceed the limitation. So, all the 20 tablets and capsules have uniform weight, which obey the standard properties required.

References


PRACTICAL 4 : DOSAGE PERFORMANCE TESTS


OBJECTIVES

  1. To determine how long the time taken needed for the tablet to disintegrate and whether it is disintegrate properly when placed in a liquid medium under the experimental condition.
  2. To determines the amount of active ingredient(s) released from a solid oral dosage form; tablet, using a known volume of dissolution medium within a predetermined length of time.


INTRODUCTION

There are two part conducted in this experiment which is first, disintegration for sugar-coated tablet and second is dissolution test for tablets. The performance test is one of a series of tests that compose the specification in a United States Pharmacopeia (USP) dosage form monograph. For an orally administered, non-solution dosage form, it is usually satisfied by either a dissolution or disintegration procedure. Dissolution acceptance criteria are usually set in private negotiations between an applicant and a regulatory agency. With information about this private agreement and other information provided in a sponsor's Request for Revision to USP, the USP's Council of Experts elaborates a public dosage form monograph. Based on the relationship between the regulatory decisions and the Request for Revision, the USP dissolution procedure links to a regulatory judgment about bioavailability and bioequivalence and, ultimately, to a judgment about safety and efficacy. The current dissolution procedure and acceptance criteria are perceived as having worked well over the years and are generally accepted.


PROCEDURES

Disintegration test for sugar-coated tablets

1.       The apparatus for the distegration test is set up according to its operation manual.
2.       The temperature is literally at 37+- 2⁰C
3.       The time is set up to 60minutes, and one paralgin tablet is introduced into each tube, add the disk into each tube and start operation.
4.       Time is taken for the disintegration of the 6 tabs accordingly.

Dissolution test for tablets

1.       Dissolution vessel was filled with the buffer solution to 900 ml mark. The temperature was setted to 37°C.
2.       One Ibuprofen Tablet was placed into each dry basket assembly.
3.       The stirring speed was setted to 150 rpm. The basket assembly was lowered into position in the vessel and the operationwas stated.
4.        10 ml samples of the dissolution medium  was withdrawed using syringes that include with filter to prevent any solid d particle from drug enter the solution from each vessel for analysis and filter the solution using suitable filter. Sampling should be done from a point half-way between the surface of the dissolution medium and the top of the rotating basket, and not less than 10 mm from the wall of the vessel.
5.         A standard solution of ibuprofen was prepared by diluting 10.0 mg of ibuprofen reference standard to 50 ml with dissolution medium.
6.        2.0 ml of sample solutionwas dilluted and 2.0 ml of standard solution to 25 ml with dissolution medium in separate25 mL of volumetric flasks.
7.         The absorption of both solutions was measured in a 1 cm cell at a wavelength of 221 nm.
8.        The percentage of  amount of ibuprofen dissolved was calculated using the following formula:

  At/As  ×  W/50  ×  2/25  x  P  ×  900  ×  25/2  ×  100/200

Where
At= absorbance of sample solution
As = absorbance of the standard solution
 W = weight of ibuprofen reference standard used.
P = purity of ibuprofen reference standard.

9.         From the results obtained, determine whether the tablets comply with the requirements of the United States Pharmacopoeia. USP limits: Not less than 75% of the stated amount of C13H18O2 dissolved in 30 minutes. 


RESULTS

Disintegration test

Observation : All six paralgin tablets literally disintegrated after 2 minutes and 50 second. No left residue seen.

Dissolution test


Percentage amount of ibuprofen dissolved

= At/As  ×  W/50  ×  2/25  x  P  ×  900  ×  25/2  ×  100/200


= 26.4 %