OBJECTIVE:
1. To analyse the particle shape and size under the microscope.
2. To describe the distribution particle size and shape.
INTRODUCTION:
The particle shape and size can be analyzed by many methods. One of it is by using a microscope, which has been done in this experiment. This analysis can be used to determine the diameter, shape, and surface area of a particle. During the experiment, we were given different type of sand to be observed and analyzed such as the size, shape and arrangement. We are using various kind of sizes of sand, which are 355 µm, 500 µm, 850 µm, lactose and also sand with all of this sizes that already been mixed together. Some batches of samples may differ by such a small amount that this difference is lost during the translation to a circle equivalent or spherical-equivalent diameter. In this experiment, we observe different sizes of particles under a microscope and we draw the shape of particles that we have observed.
MATERIALS AND APPARATUS:
Microscope, sand with particle size of 355 µm, 500 µm, 850 µm, lactose and also sand with various sizes.
PROCEDURES:
1) 5 different types of samples were analyzed by using microscope, by observing the size and shape of given particle.
2) The samples were examined first by 4X10 magnification, followed by 10X10 magnification.
3) The particle shape is sketched and the overall particle shape of that material is stated.
OBSERVATIONS :
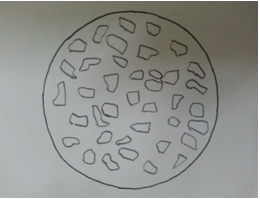
Size of sand: 355 µm
(All the particles are small, same size and irregular in shape.)
a) 4 X 10 magnification
b) 10 X 10 magnification
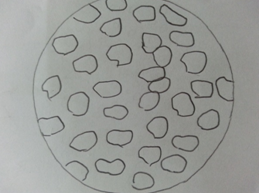
Size of sand: 500 µm
(All the particles are larger than 355 µm, the size is almost same and the shape is irregular.)
c) 4 X 10 magnification
d) 10 X 10 magnification
Size of sand: 850 µm
(The particles are larger compare to 500 µm, particles that present on the upper position look larger and can be seen clearly while particles at the lower position look smaller. The shape of the particles is irregular and without a defined shape.)
e) 4 X 10 magnification
f) 10 X 10 magnification
Lactose
(All particles are small, some of them have round shape while others are irregular in shape.)
g) 4 X 10 magnification
h) 10 X 10 magnification
Sand of various size
(All the particles have different size, most of them have irregular shape with different number of edges and sides.)
i) 4 X 10 magnification
j) 10 X 10 magnification
QUESTIONS:
1. Briefly describe the various statistical methods that can be used to measure the diameter of a certain pa
rticle.
One of the methods is projected area diameter which is measured based on the equivalent area to that of projected image of that particle. Projected area is two-dimensional area measurement of a three-dimensional object by projecting its shape on to an arbitrary plane. Besides, another useful method is the projected perimeter diameter which is based on the circle having the same perimeter as the particle. Both of these methods are independent upon particle orientation. They only take into account of 2 dimensions of the particle, thus inaccurate for unsymmetrical particle.
Feret’s and Martin’s diameter that considering the orientation of the particle are another methods to measure the diameter of certain particle. They are two parameters in this method which are Feret’s diameter and Martin’s diameter. Feret’s diameter is the mean distance between two parallel tangents to the projected particle perimeter while Martin’s diameter is the mean chord length of the projected particle perimeter, which can be considered as the boundary separating equal particle area.
The other method is by using Fourier analysis to provide an accurate quantification of particle morphology and texture. Three lower order Fourier descriptors, denoted “Signature Descriptors” provide measures of Elongation, Triangularity and Squareness, whilst an additional descriptor, denoted “Asymmetry” provides a measure of particle irregularity. They describe the overall shape of soil particles (defined as “morphology”). A summary of higher order descriptors provides textural information which is related to local roughness features (defined as “texture”).
2. State the best statistical method for each sample that you used.
As such, the best statistical method is Feret’s and Martin’s diameter. It is because both of these are the statistical diameter which is the average over many different orientations to produce a mean value for each particle diameter. This will give an average value of diameter in more orientation and giving an average diameter value which is more accurate. Besides, since it is accessing the three-dimensional image of particle, we can use the electron microscope that considering the orientation and shape of the image.
DISCUSSION:
The ability to analyze and characterize particle size and shape can significantly improve the manufacturing efficiency and product performance. Thus, we can use of microscopy and image analysis as the most reliable technique to characterize particle shape, size and volume distribution. From this practical, it is found that the overall shape of the sand is asymmetrical. One of the methods used to measure a particle is the projected area diameter which is measured based on the equivalent area to that of projected image of that particle. Another method is the projected perimeter diameter which is based on the circle having the same perimeter as the particle. Both of the methods do not account the 3 dimensional shape of particle (orientation). They only consider the 2 dimensions of the particle, thus it is inaccurate for unsymmetrical particle.
During the experiment, we put different types of sand on slide to be directly observed them using a light microscope. The sand should be spread evenly and just thin layer to avoid agglomeration that will affect the observation. We observed that the particles are irregular in shape. The size analysis is carried out on two-dimensional image of particles which are generally assumed to be randomly oriented in 3-dimensional and they are viewed in their most stable orientation.
Feret’s and Martin’s diameter that considering the orientation of the particles is one of the methods to measure the diameter of particle. Feret’s diameter is the mean distance between two parallel tangents to the projected particle perimeter while Martin’s diameter is the mean chord length of the projected particle perimeter. The best statistical method is Feret’s and Martin’s diameter because both of them use statistical diameter which are the average over many different orientations to produce a mean value for each particle diameter. Besides, since it is accessing the three-dimensional image of particle, we can use the electron microscope that considering the orientation and shape of the image.
CONCLUSION:
Different types of sands have different shape and size which can be analyzed through a light microscope. We are able to determine the overall distribution of shape and size of this particle which are asymmetrical and irregular.
REFERENCES:
1. Pharmaceutics, The science of dosage form design (2nd Edition) Michael E.Alton Edinburgh London New York Philadophia St Louis Sydney Toronto 2002.
2. http://www.en.wikipedia.org
3. http://www.jenike .com
4. Physicochemical Principals of Pharmacy (2nd Edition) AT Florence and D.Attwood, The Macmillan Press Ltd.


No comments:
Post a Comment